HELP US MAP RED FLAGS!
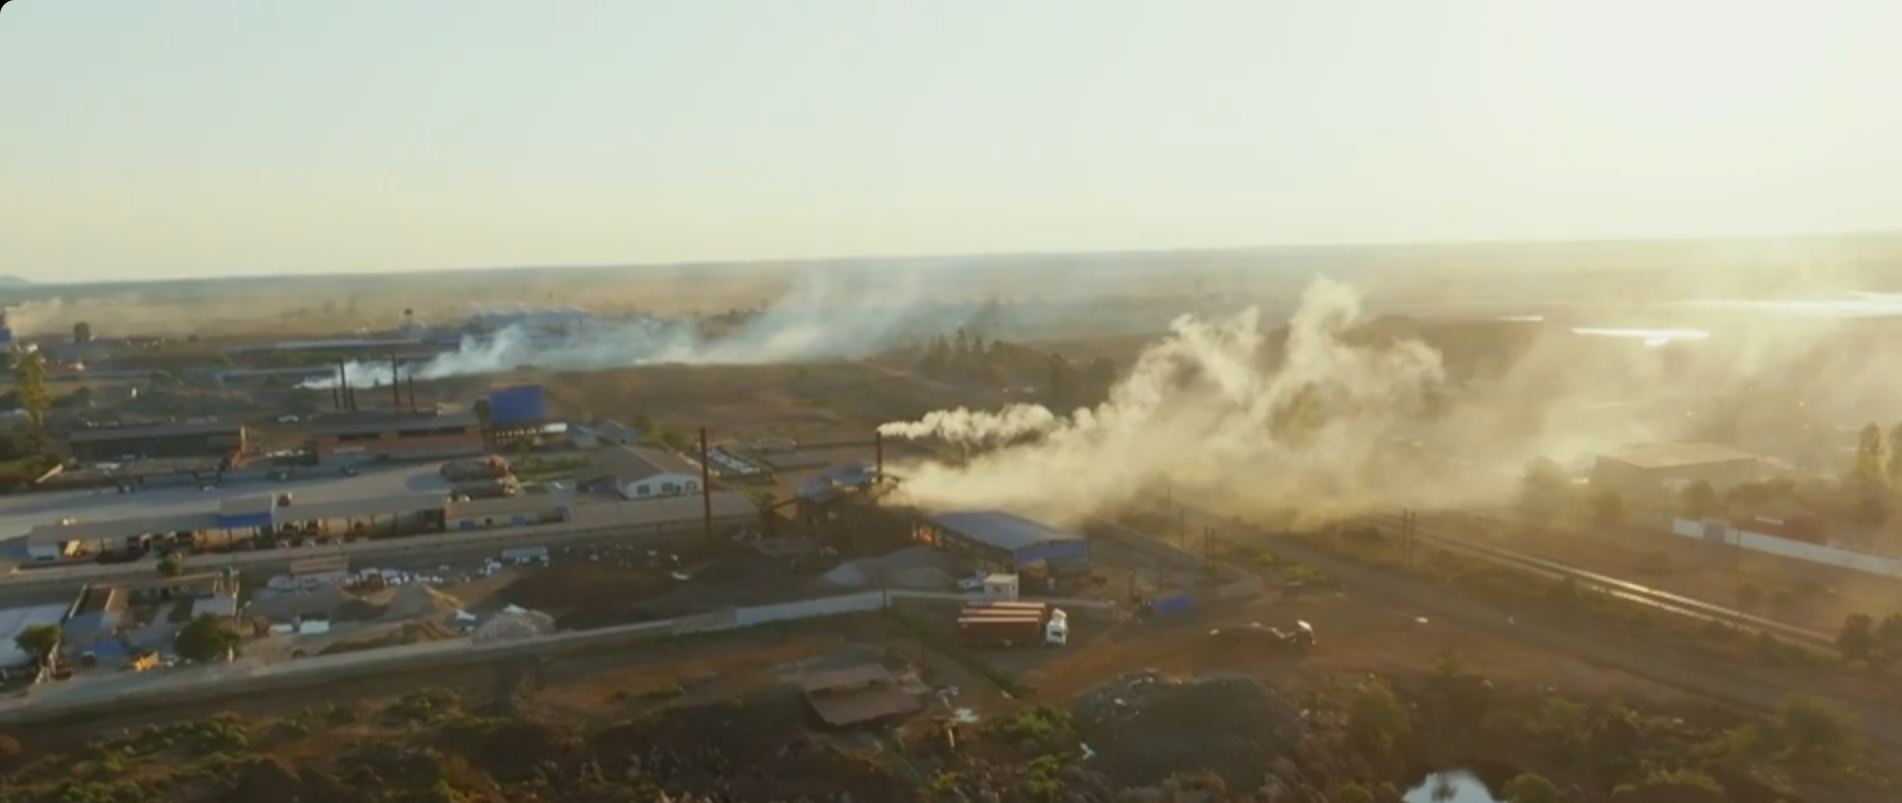
Climate Change is the greatest threat we face and corruption poses a threat to climate action. As part of our Climate Change and Environmental Sustainability (CCES) strategic focus area, we are launching the Climate and Environment Transparency – Waving the Red Flag portal to gather, document, and report information on irregularities, funds misappropriation, corruption cases and other areas of concern relating to environmental governance management in Zambia.
Waving the Red Flag aims to be the leading online portal for all Zambians who want to defend our environment, expose the truth and play an active role in the fight against corruption.
Report Corruption
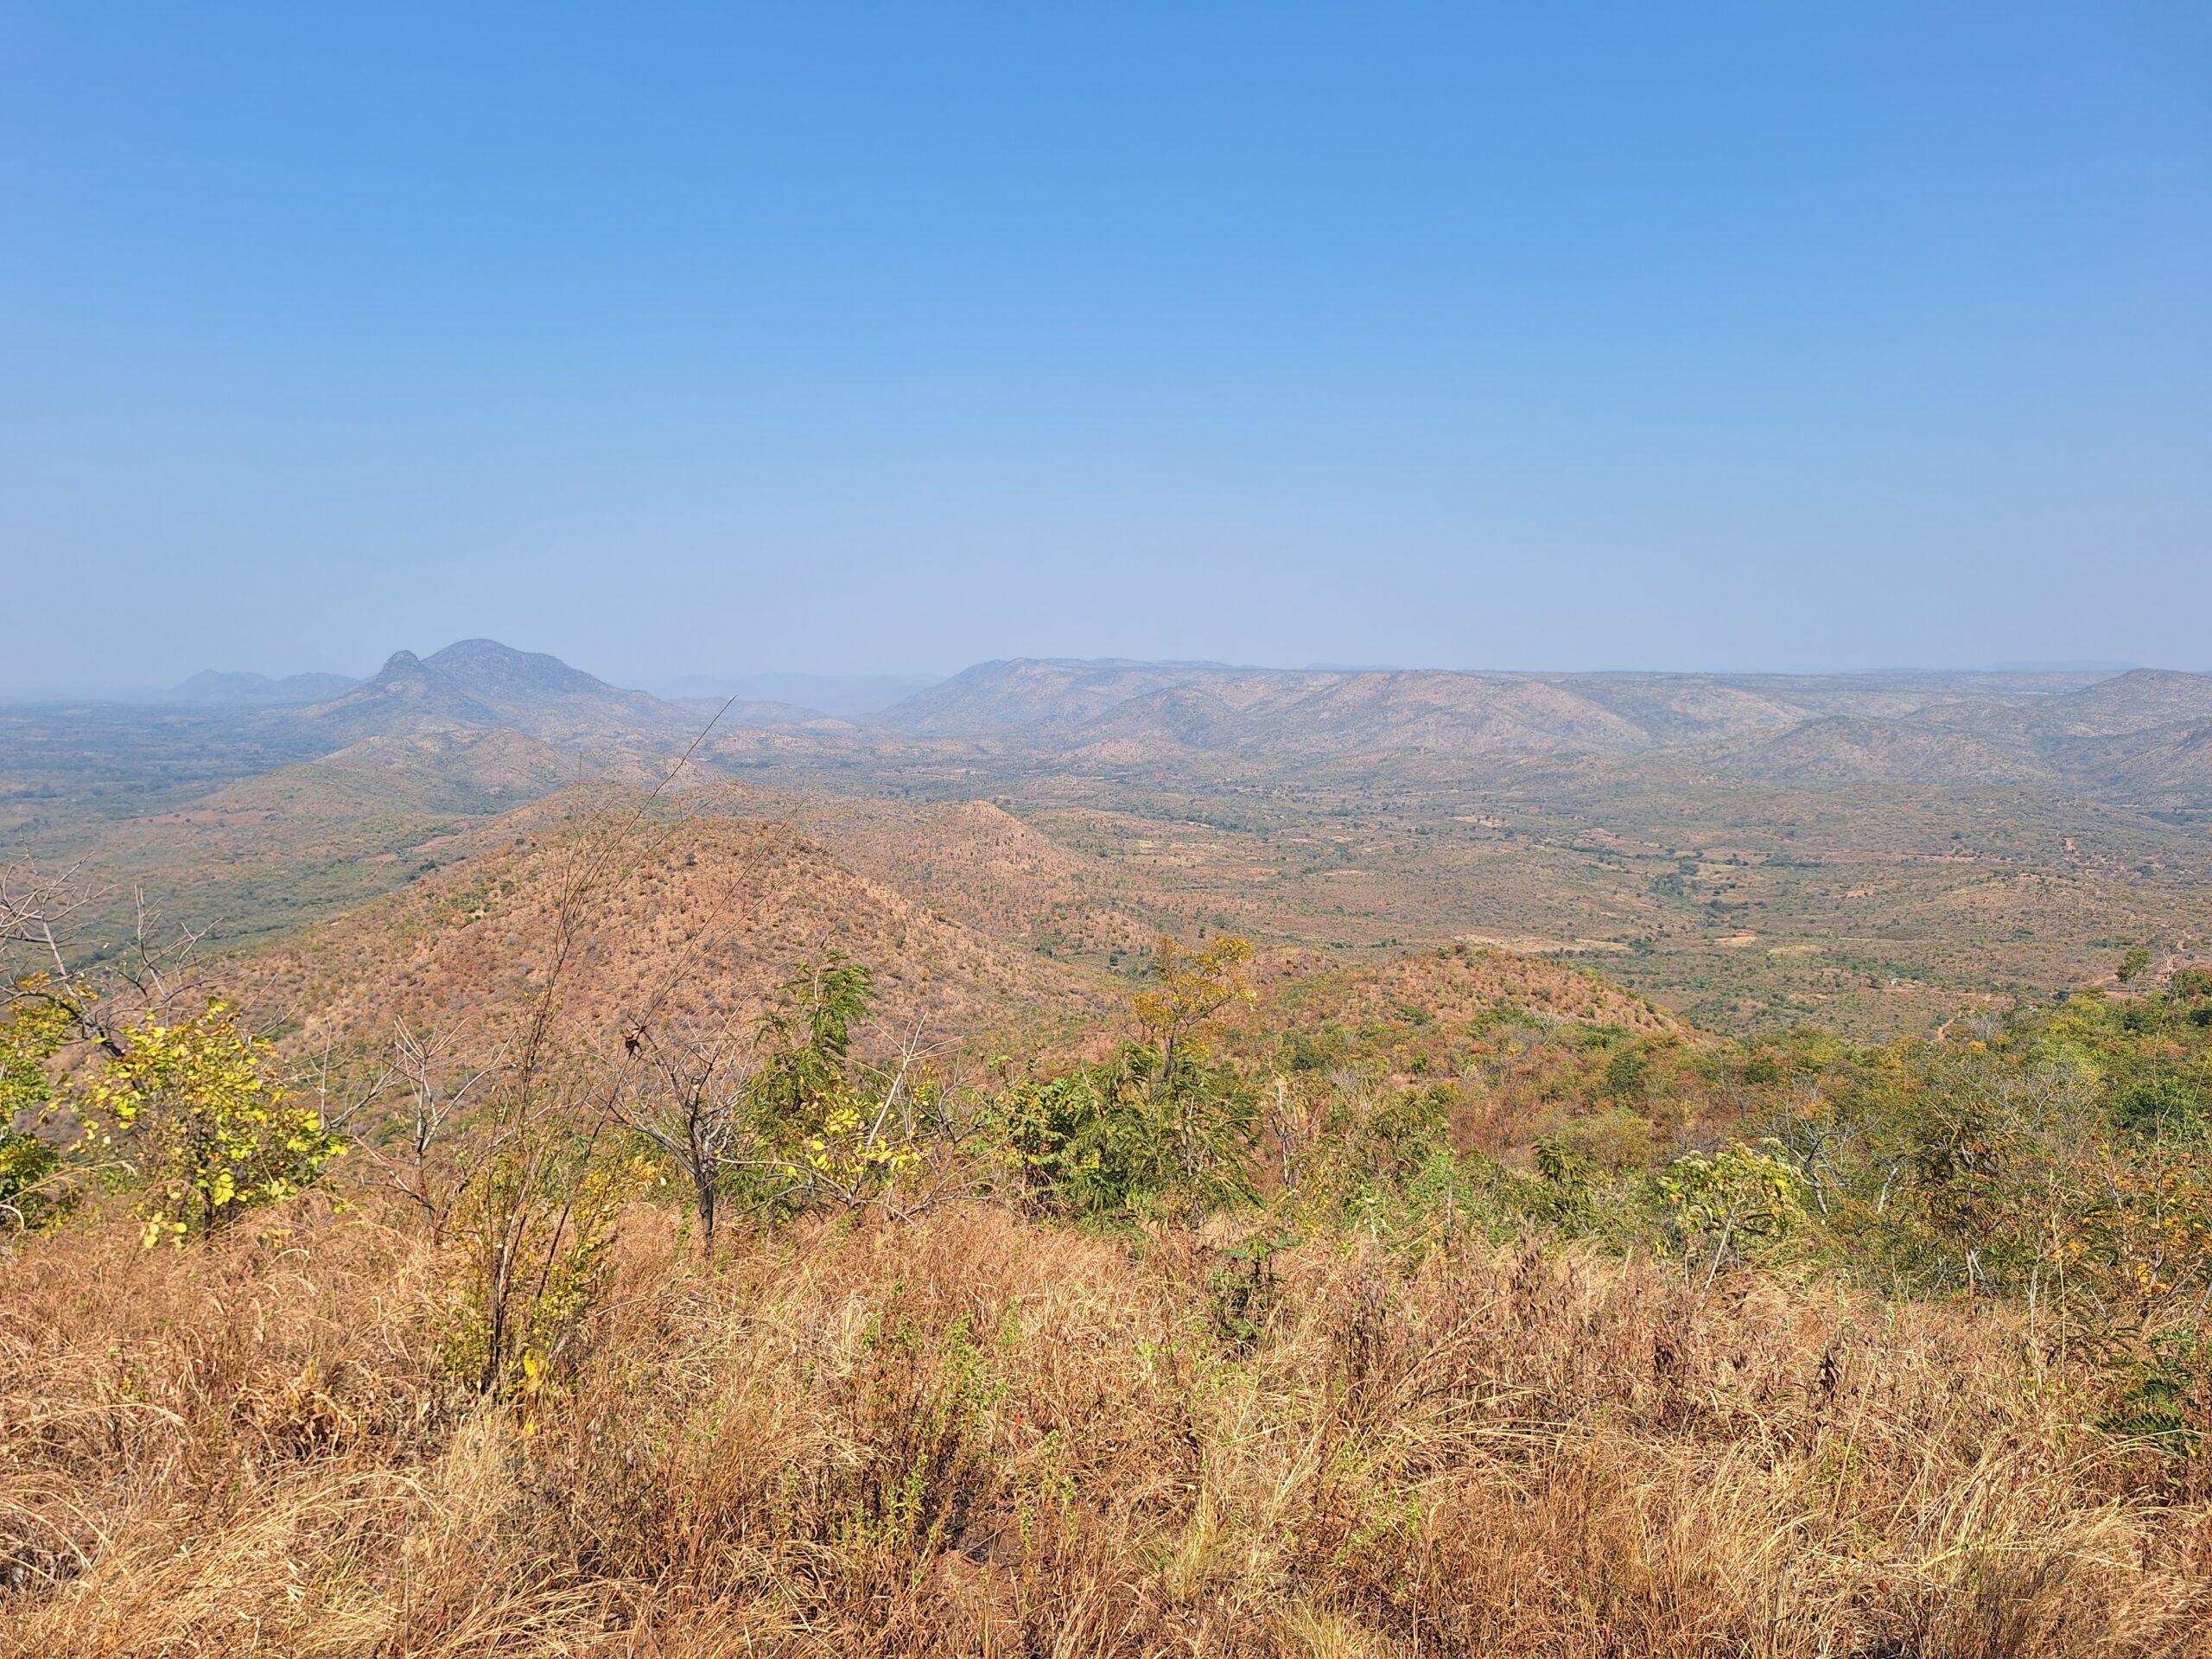
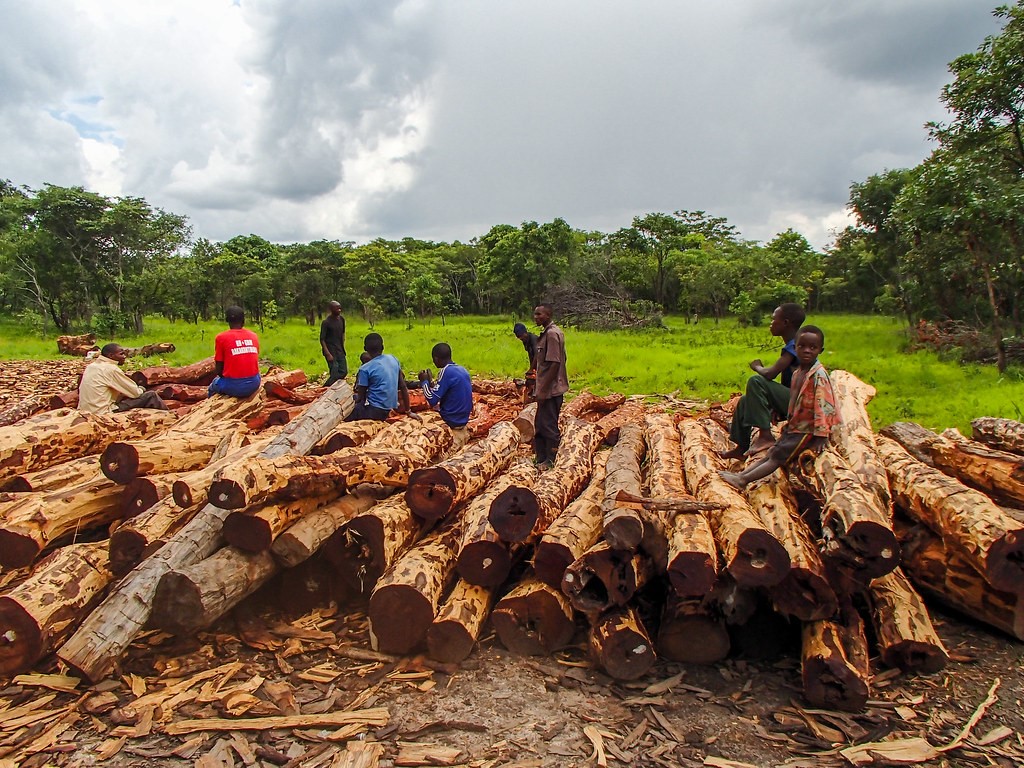
- Our environment and forests are endangered: in the last 20 years we have seen a 7.3% decrease in our tree cover in Zambia
- Climate change and environmental mismanagement threaten our environment, forests, livelihoods and bio-diversity
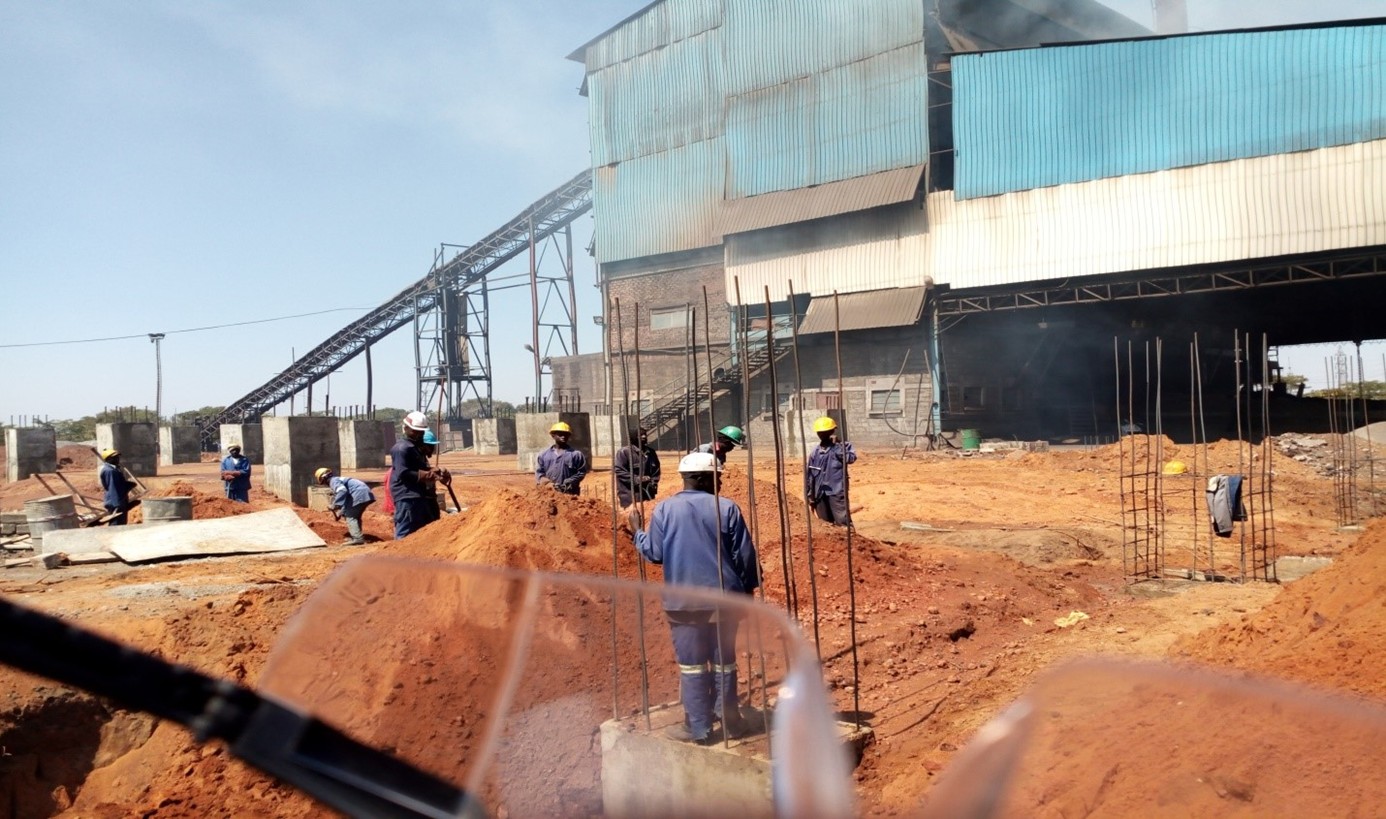
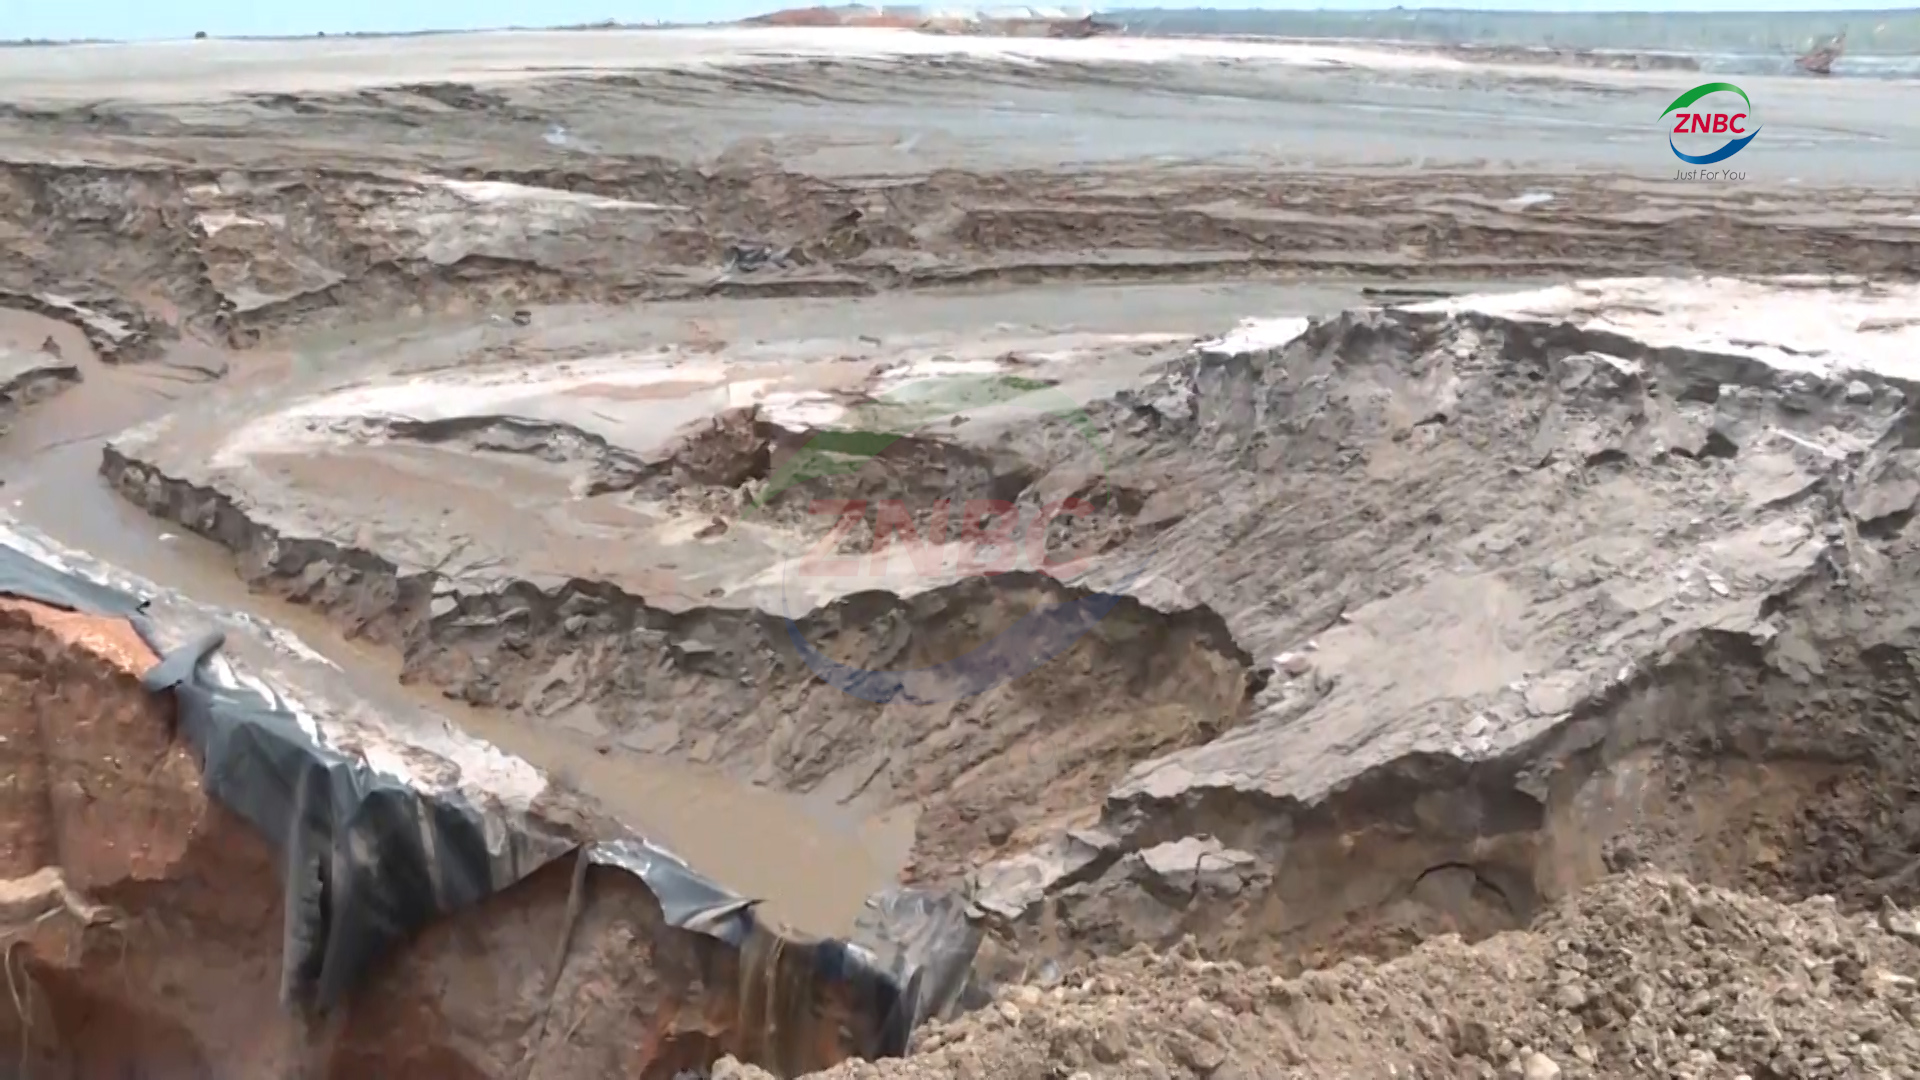
- We are increasingly aware of irregularities and mismanagement of our environmental resources: check the red flags in our map to find out more
- Our forests and our environment are our future. We bear responsibility to protect them, reporting any wrongdoing we are aware of, holding duty bearers accountable, and campaigning for our rights.
- Access our report corruption platform and fill in the form;
- You will be contacted by our officer who handle complaints and cases for further details and next steps;
- The data will be processed anonymously;
- Alternatively, if you want to share your story publicly, you can access our Share your Story platform;
- For any enquiry about reporting corruption, please contact: +260 973 683 431 / +260 955 504 535
Our project has just begun working on the ground. Soon we will be sharing with you the stories and testimonies of our allies on the ground, who by reporting corruption cases help us unmask wrongdoers and defend our environment. You can be an ally! Start by following us and reporting any wrongdoing.
Tracking our losses: forest cover and CO2 emissions
According to FAO, 60% of Zambia’s land surface is under forest cover (2020). Over the years, Zambia’s tree cover has been gradually deteriorating. From 2010 to 2022, Zambia lost 1.77 Mha of tree cover, equivalent to a 7.3% decrease in tree cover since 2000, and 660 Mt of CO₂ emissions, while in the same timespan, Zambia gained 768 kha of tree cover, less than half of the surface lost. 2021 recorded the highest loss of tree cover in the last decade (201kha). From 2010 to 2022, Zambia lost 28.6 kha of humid primary forest, decreasing by 8.6%. The loss of primary forests accounted for 1.6% of the total tree cover loss.
The map to your left gathers data on Zambia’s tree cover loss and gains in the last 20 years. Feel free to explore the map and zoom in each province, to see which areas were most affected in terms of tree loss. By clicking on the legend in the map, you can also restrict the time frame analysed by the map; this will allow you to see which periods have seen the highest degree of tree loss. The graphs below unpack this data for you for each province. The data and the maps presented in this section are retrieved from the platform Global Forest Watch and from the World Bank.
Legend


